Figure 3.
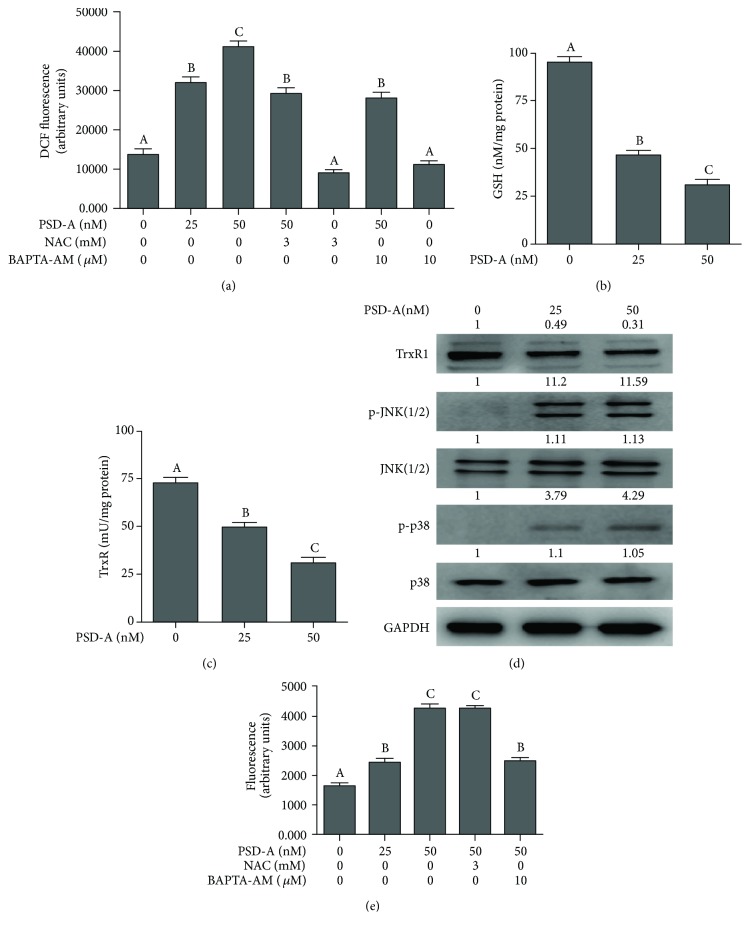
PSD-A stimulates oxidative stress in A549 cells. (a) A549 cells were treated with PSD-A in the presence or absence of BAPTA-AM (10 μM) and NAC (3 mM) for 24 h, and ROS generation was determined by staining the cells with DCFH-DA. (b, c) A549 cells were treated with PSD-A for 24 h and intracellular level of GSH, and TrxR activity was measured according to the kit's instructions. Data in (a–c) are expressed as mean ± SEM (n = 3). Columns not sharing the same superscript letters differ significantly (P < 0.05). (d) Cells were treated with PSD-A for 24 h, and expressions of TrxR1, p-JNK1/2, JNK1/2, p-p38, and p38 were measured by Western blot. (e) Cells were treated with PSD-A for 24 h as indicated, and intracellular free Ca++ was measured using Fluo-3 AM fluorescent probe as described in Materials and Methods. Data are expressed as mean ± SEM (n = 3). Columns not sharing the same superscript letters differ significantly (P < 0.05).

