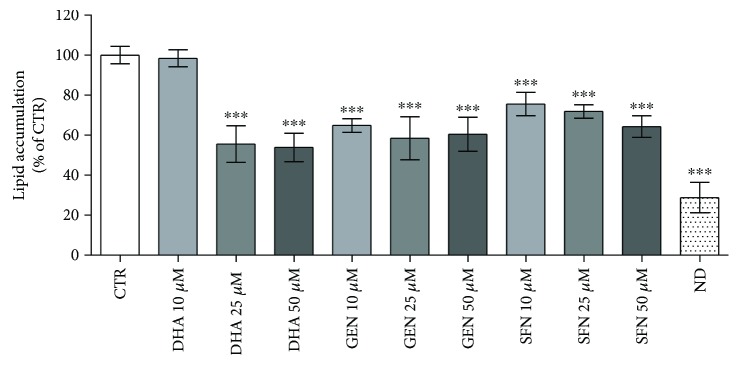
Figure 3.
Lipid accumulation in supplemented and control cells. Data are expressed as a percentage relative to unsupplemented control cells (CTR), assigned as 100%. Statistical analysis was performed by one-way ANOVA (p < 0.001) followed by Dunnett's test: ∗∗∗p < 0.001 versus CTR. ND: nondifferentiated cells, before the beginning of the differentiation process.

