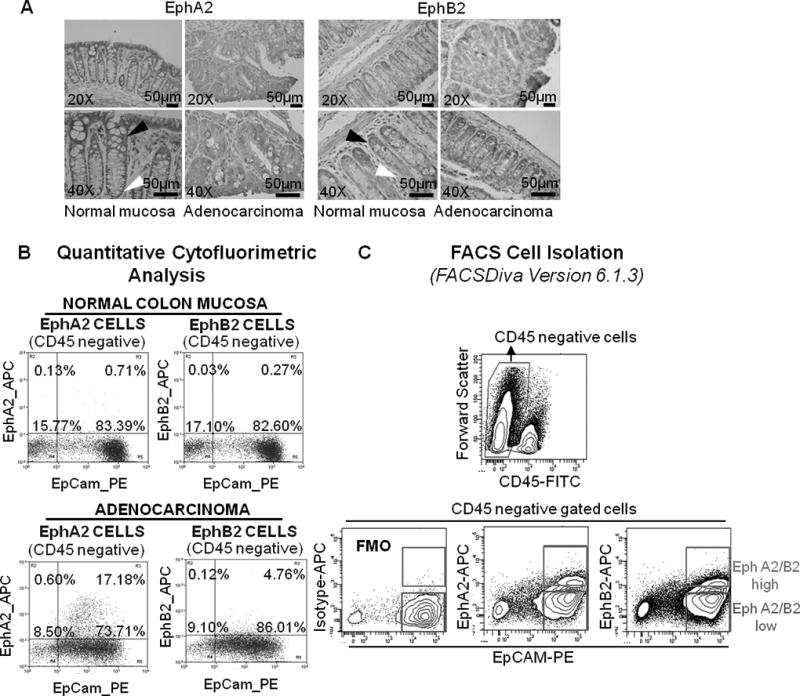
Figure 1.

Isolation of mouse colorectal cell populations based on EphA2 and EphB2 expression. (A) IHC analysis on normal colorectal tissue of control untreated mice demonstrated maximum EphA2 and EphB2 expression in crypt apical columnar cells (white arrowhead) and basal crypt compartment (black arrowhead), respectively; adenocarcinoma shows a diffuse staining for both EphA2 and EphB2 (20× and 40× magnification). (B) Flow cytometry of crypt cells stained for EphA2 revealed an increase of EphA2high cell subpopulation in adenocarcinoma with respect to normal mucosa. EphB2high cells were poorly represented in normal mucosa and colon adenocarcinoma. (C) Representative cell sorting strategy. EphA2high and EphA2low cells as well as EphB2high and EphB2low subpopulations were sorted after gating for CD45- and EpCAM+ staining to ensure epithelial identity. Fluorescence Minus One (FMO) control stain strategy was used to accurately identify EphA2 and EphB2 expressing cells in the fully stained sample.
