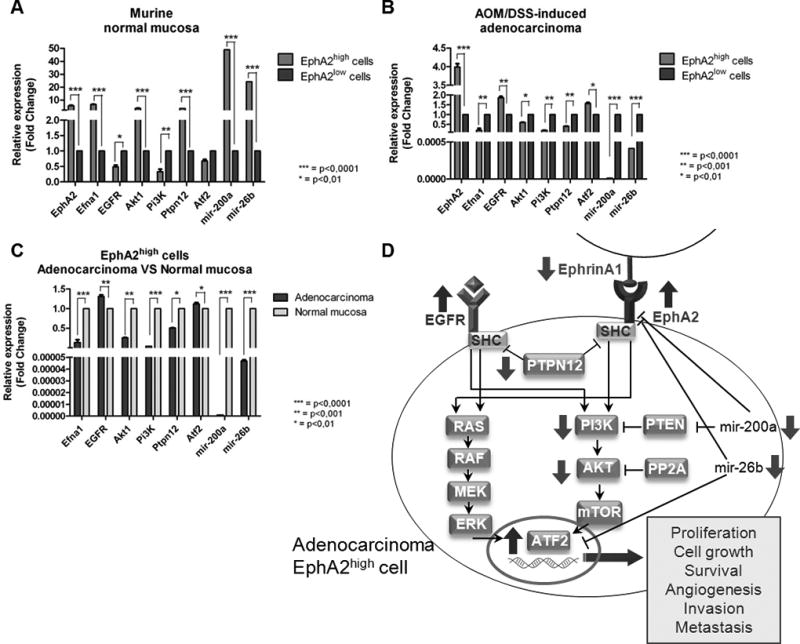
Figure 3.

Q-PCR analysis of EGFR signaling effectors in EphA2 cell subpopulations of murine CRC. Data are represented as mean +/− SD. Statistically significant differences were calculated using Student’s t-test: *** p<0.0001; ** p<0.001; * p<0.01. Gene expression levels in EphA2high and EphA2low cell subpopulations of (A) normal mucosa and (B) adenocarcinoma. (C) Gene expression levels in EphA2high subpopulation of adenocarcinoma and EphA2high subpopulation of normal colic mucosa. (D) Schematic representation of the dysregulation of EphA2/EGFR pathways crosstalk in adenocarcinoma EphA2high cell.
