Figure 4.

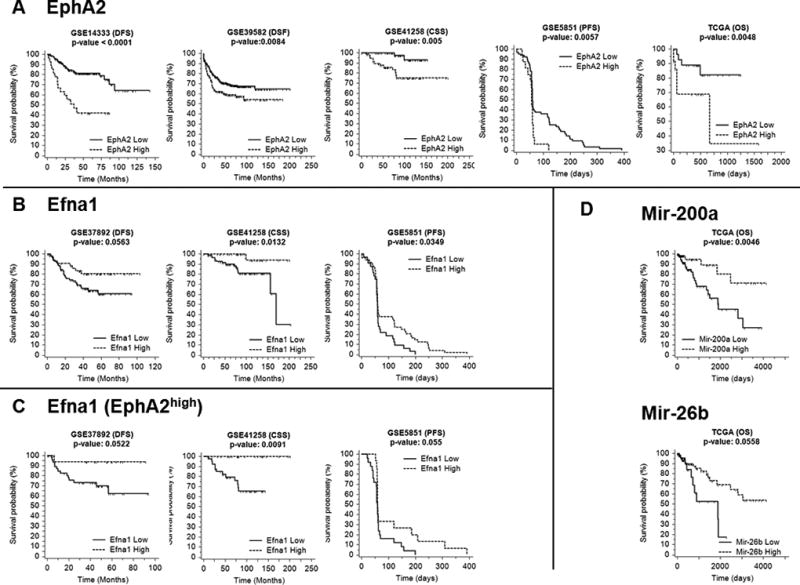
Kaplan-Meier survival curves of (A) EphA2high (dashed line) versus EphA2low (solid line) for cohort 1, 3, 4, 5 and 6 (B) Efna1high (dashed line) versus Efna1low (solid line) for cohort 2, 4 and 5. (C) Analysis of Efna1 conducted only for patients belonging to EphA2high group for the same cohorts of B. (D) Kaplan-Meier survival curves on TCGA dataset of mir-200ahigh (dashed line) versus mir-200alow (solid line) and mir-26bhigh (dashed line) versus mir-26blow (solid line). Expression value thresholds were determined through maxstat R package. P-values were calculated using log-rank tests. Tick marks represent censored data.
