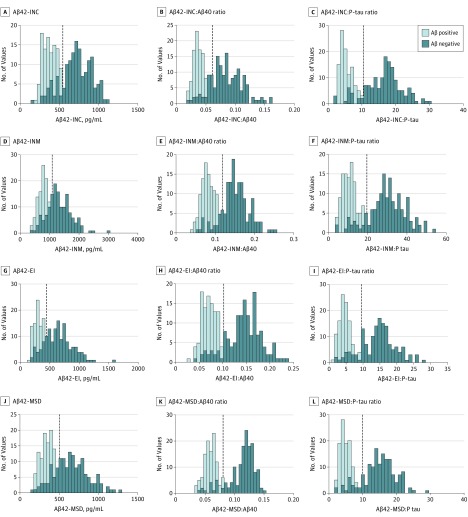
Figure 2. Frequency Plots of Cerebrospinal Fluid (CSF) β-Amyloid (Aβ) 42 Levels and Aβ42:Aβ40 and Aβ42 to Phosphorylated Tau (P-tau) Ratios.
Histograms of frequency distribution for CSF Aβ42 levels and the Aβ42:Aβ40 and Aβ42:P-tau ratios across groups with Aβ-positive (n = 113) and Aβ-negative (n = 149) visual ratings. Veritical dashed lines indicate cutoff points associated with the Youden J index. EI indicates EUROIMMUN; INC, classic INNOTEST; INM, modified INNOTEST; and MSD, Meso Scale Discovery.

