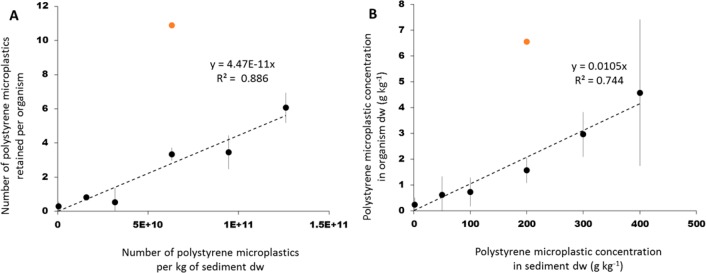
Figure 3.
Mean PS microplastic concentration (n = 4) per individual of G. pulex (±SD) as a function of the PS microplastic concentrations in sediment, as (A) number of PS microplastics retained per organism by number of PS microplastics per kg of sediment dw; (B) g kg–1 of PS microplastics retained per organism dw by g kg–1 of PS microplastics per sediment dw. Linear regressions were based on the individual data points (n = 22) with omission of one suspected outlier (orange marker).

