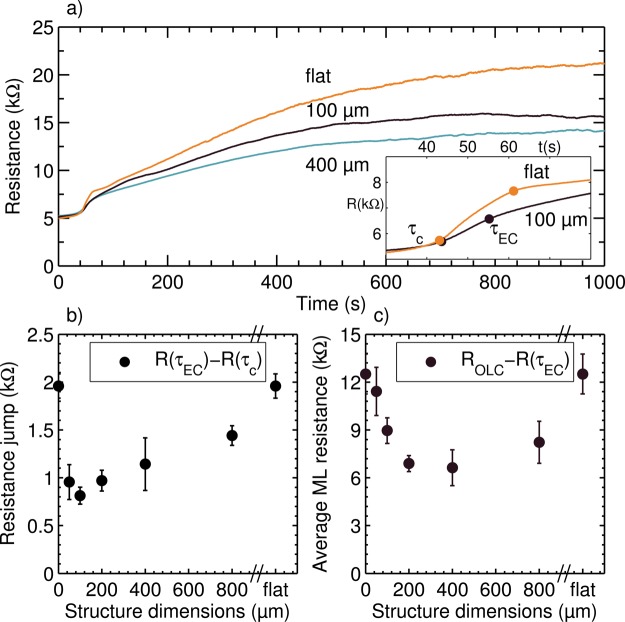
Figure 3.
(a) Electrical resistance in time after applying ΔV = 1 V for different membranes. The inset shows the onset of OLC, displaying the critical depletion time (τc) and EC onset time (τEC). (b) Resistance increase (R(τEC) – R(τc)) indicates the threshold voltage drop needed to start EC. The value of the flat membrane has been placed at the beginning and the end of the x axis, because it can be seen as either a zero or an infinite structure dimension. (c) Average ML resistance, calculated as the average resistance value over the last 400 s (ROLC) and subtracting (R(τEC)), as a function of structure dimension. The error bars in (b,c) represent the 95% confidence interval calculated from the mean values in the 3 to 6 repeated measurements with the same membrane.

