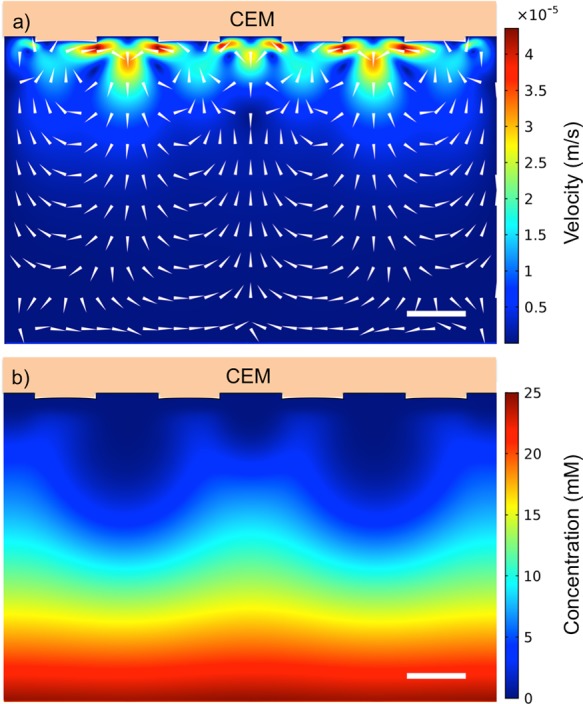
Figure 8.

(a) Simulated flow profile at a membrane with 400 μm structures in 10 mM CuSO4 with ΔV = 0.5 V between the membrane interface and the opposite edge of the reservoir. (b) Simulated cation concentration profile for a membrane with 400 μm structures after the simulations have achieved steady state. The scalebars represent 400 μm.
