
Figure 3.
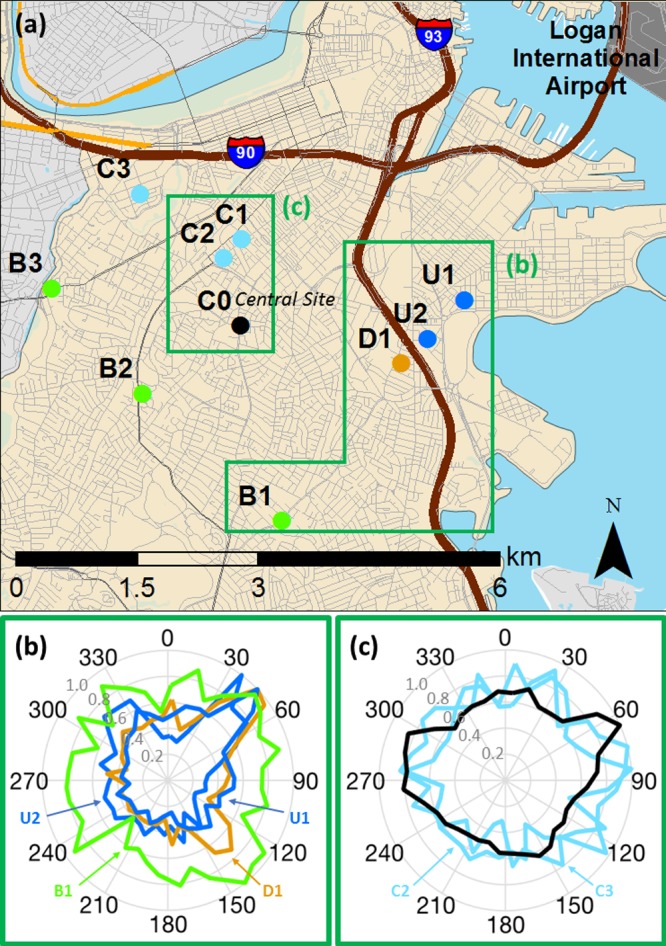
(a) Locations of the central site (C0, black) and nine residences monitored in Boston. Residences were classified as upwind (U, dark blue) of the highway during impact-sector winds, downwind of the highway (D, orange) during impact-sector winds, community sites (C, light blue) and background sites (B, green). (b)–(c) Normalized (by the maximum) PNC roses are based on hourly medians; concentric circles are increments of 0.2 on a 0–1 scale.