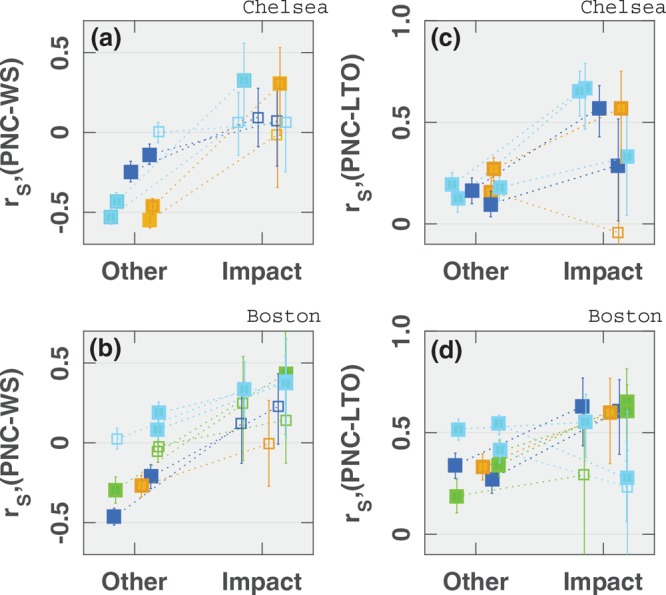
Figure 4.

Correlation coefficients between outdoor PNC and wind speed (a, b) and LTO (c, d) for seven Chelsea and nine Boston residences during impact-sector and other winds. Filled squares represent significant correlation (p-value <0.05) and unfilled squares represent insignificant correlations. X-axis is categorical but points have been jittered to enhance visual clarity by reducing overlap. For description of colors, see captions for Figures 2 and 3.
