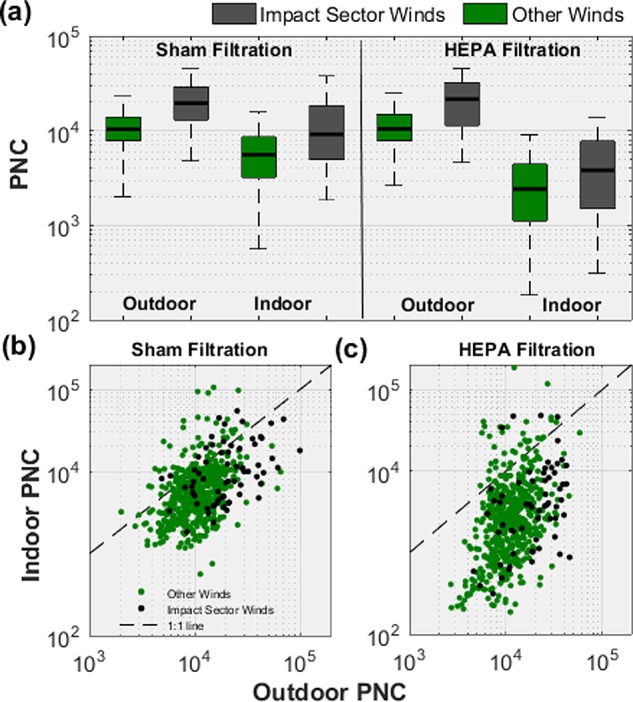
Figure 5.

(a) Tukey’s boxplots of indoor and outdoor PNC data during sham and HEPA filtration from all 16 homes. The horizontal line inside each box is the median; the boxes extend from the 25th to the 75th percentile and the whiskers extend to 1.5*interquartile range. In (b) and (c) each point in the scatterplots represents the median of hourly medians classified into 10-degree-wide wind sectors.
