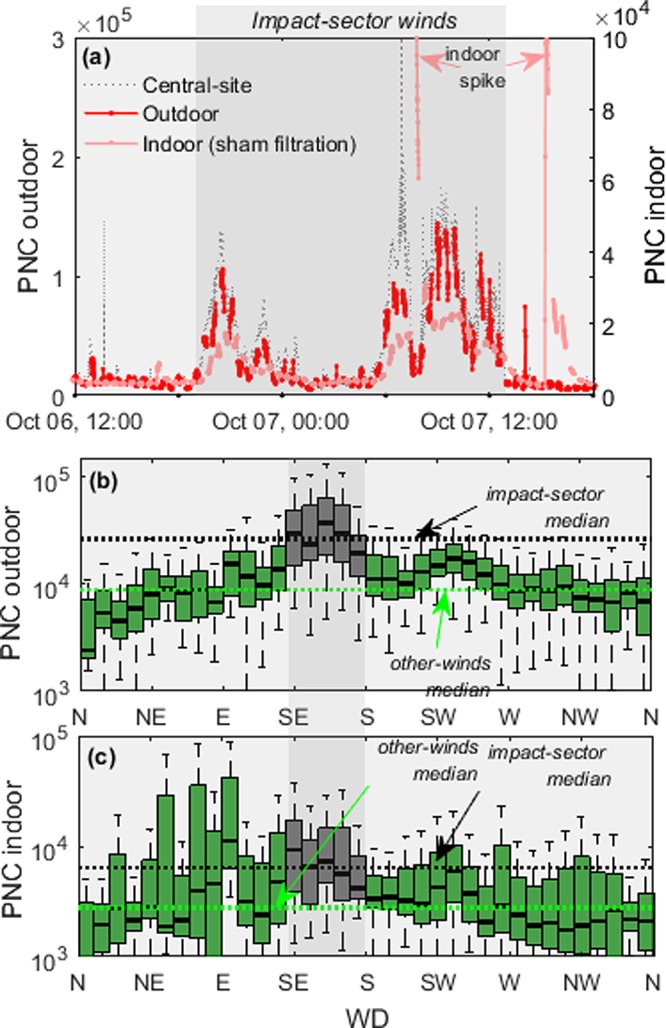
Figure 6.

PNC time series for October 6–7, 2014 for site C3 in Chelsea is shown in (a). Impact-sector winds are highlighted in gray. Tukey’s boxplots in (b) and (c) show outdoor and indoor PNC. The horizontal line inside each box is the median, the boxes extend from the 25th to the 75th percentile and the whiskers extend to 1.5*interquartile range.
