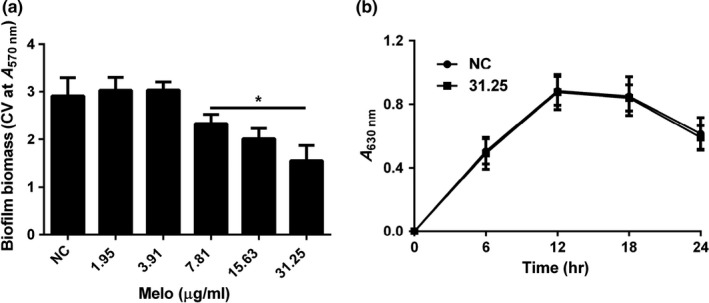
Figure 1.

Effect of Melo on biofilm and planktonic cell of PAO1. (a) Biofilm formation was indicated by A570 nm in microplate with CV staining; (b) Growth curves of PAO1 with and without Melo. Total planktonic cell growth was traced by measuring A630 nm. Bars indicated standard error (SE) of the mean. * indicates that the mean A570 nm is statistically different from the control group with p < .05
