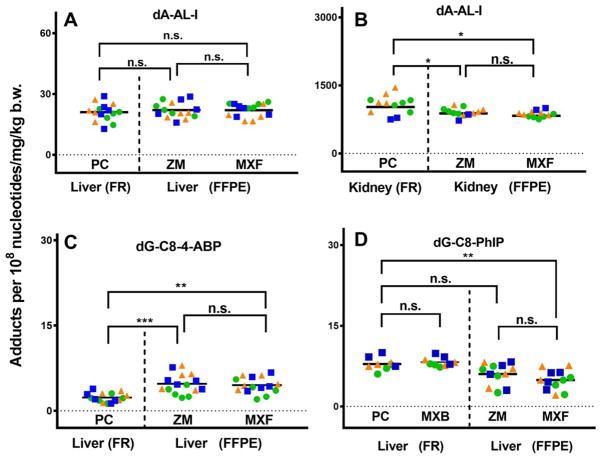
Figure 3.
Levels of carcinogen DNA adduct in rodent tissues. One way analysis of variation with Tukey’s multiple comparison test (Prism 6, San Diego, CA); ns, not significant; *p < 0.05, **p < 0.005, and ***p < 0.0005., Fresh frozen tissues were processed with phenol-chloroform extraction or Maxwell® 16 LEV Blood DNA kit (MXB, for dG-C8-PhIP only). FFPE tissues were processed with ZR FFPE DNA Miniprep™ kit (ZM) or Maxwell® 16 FFPE plus LEV DNA Purification kit (MXF). FR, freshly frozen tissue; FFPE, FFPE tissue. Data from different groups are depicted by different colors and shapes: day 1, green circle; day 2, orange triangle; and day 3, blue square. The lowest adduct level of dG-C8-PhIP in FFPE tissues processed by ZM or MXF on day 1, 2, and 3 is the same animal.

