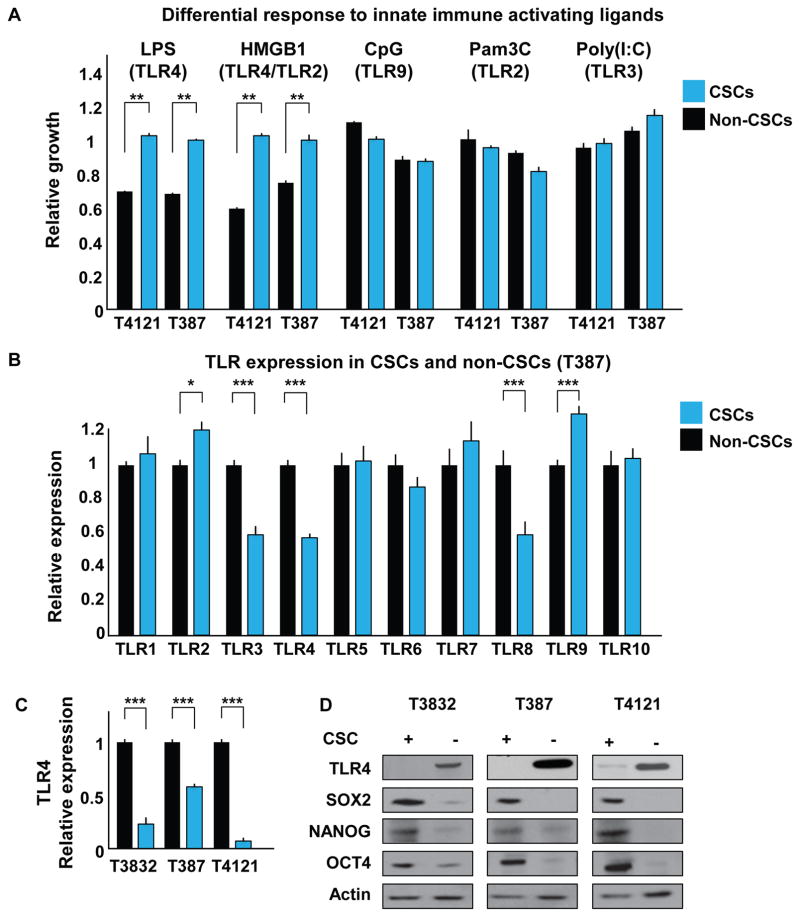
Figure 1. CSCs and Non-CSCs Respond Differentially to Innate Immune Stimulation and Express Differential Levels of TLR4.
(A) CSCs (blue) and non-CSCs (black) were incubated with TLR ligands for 7 days, and proliferation relative to day 0 was assessed by CellTiter Glo assay and normalized to an untreated control. The following concentrations were used: LPS, 500 ng/mL; HMGB1, 1 μg/mL; CpG, 2 μM; Pam3C, 300 ng/mL; and Poly(I:C), 10 μg/mL.
(B) The mRNA expression level of all known human TLRs was evaluated by qRT-PCR in CSCs and non-CSCs; data were normalized to the non-CSC group.
(C and D) mRNA (C) and protein (D) levels of TLR4 were analyzed in CSCs and non-CSCs using qRT-PCR and western blot, respectively. Actin was used as an internal control for qRT-PCR and a loading control for western blotting.
Each experiment was performed at least three times. Data are represented as mean ± SEM. *p < 0.05, **p < 0.01, and ***p < 0.001 as assayed by one-way ANOVA. See also Figure S1.

