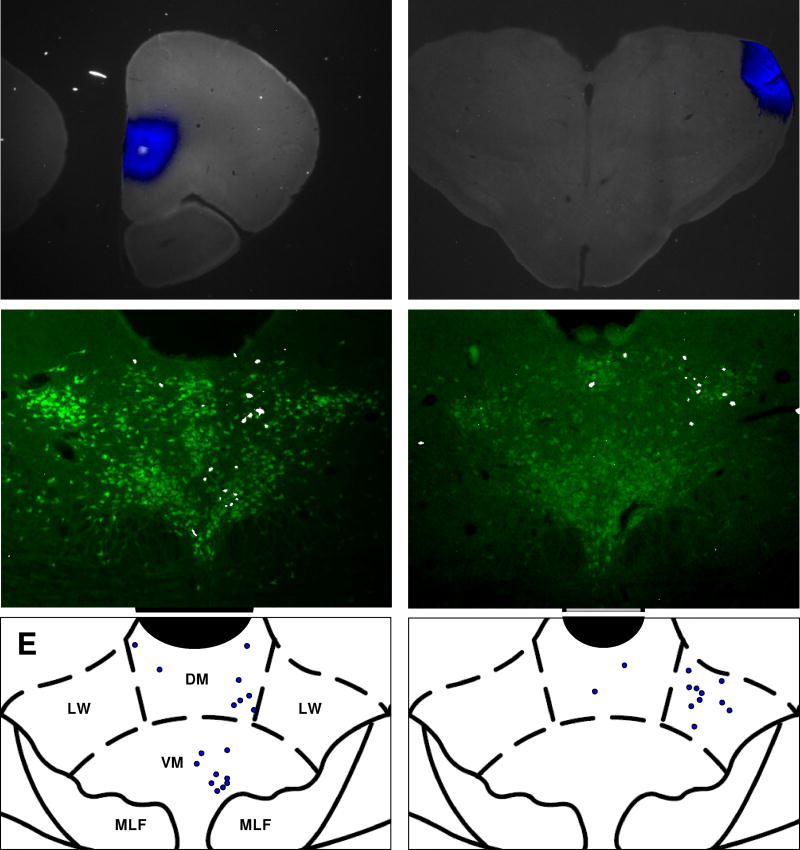
Figure 1. Anatomical distribution of labeled neurons within the DR.
A–B, representative photomicrographs of FG injections (blue) into the mPFC (A) or LGN (B). C-D, coronal sections through the brainstem showing representative distributions of FG-labeled neurons (white) that project to mPFC (C) or LGN (D). Serotoninergic neurons are shown in green. E-F, Coronal atlas images showing the borders and sub-divisions of the DR near its widest point (bregma −8 mm). Blue circles indicate the locations of FG-labeled neurons from C and D. Aq = cerebral aqueduct. DM = dorsomedial, VM = ventromedial, LW = lateral wing, MLF = medial longitudinal fasciculus. In 1C and 1D, FG fluorescence was pseudocolored to white for better visibility at small size; FG fluorescence was pseudocolored to blue in all other images that contain FG signal. Stereotaxic atlas images adapted from Paxinos and Watson, 1997.

