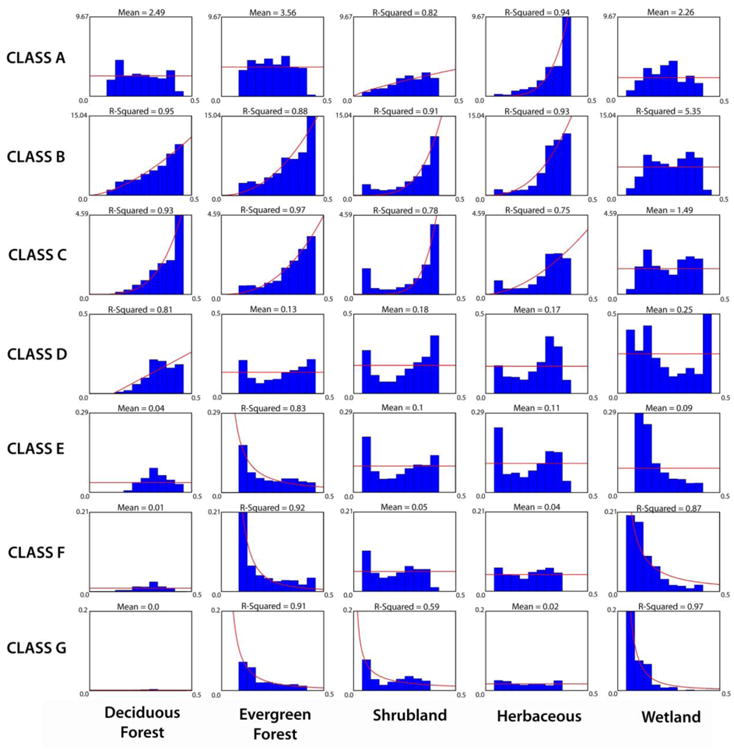
Figure 2.

Binned average fire occurrence over each complete year and associated fitted functions or mean values for each analyzed land cover type by fire size class. The x-axis of each chart denotes surface soil moisture as a percentage, and the y-axis shows the average number of fires per 0.25 degree cell for that soil moisture bin. The fire size classes are defined by Short (2015), displayed in Table 1.
