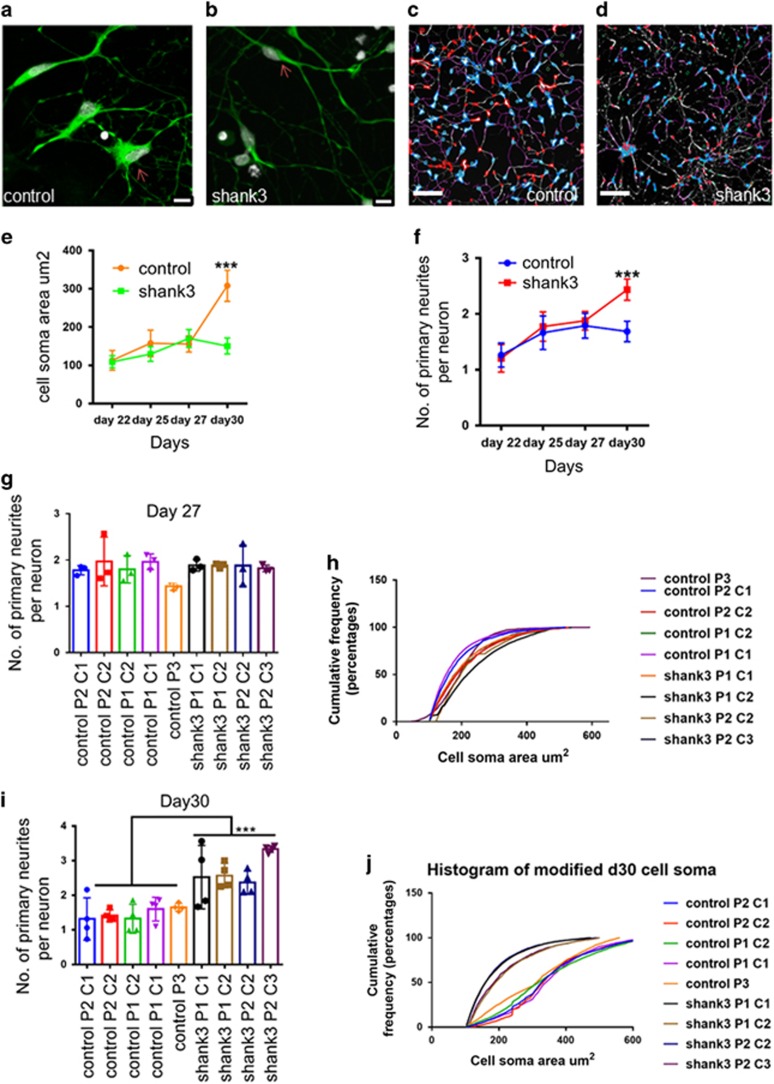
Figure 2.
Morphological deficits found in immature SHANK3 patient neurons. (a) Control neurons cell soma. (b) SHANK3 neurons cell soma (scale=10 μm, day 30 neurons stained with DCX (doublecortin; green) and DAPI (4,6-diamidino-2-phenylindole; gray)). (c and d) Bare images of Control and SHANK3 DCX+ neurons at day 30 taken during high-content screening, scale=200 μm. (e) High-content screening performed to find changes in cell soma area μm2 from day 22 (late neural progenitors) to day 30 (immature neurons). Data are represented as mean±s.e.m., Mann–Whitney U-test was performed for each time point; the only difference was seen at day 30. ***P<0.001. (f) High-content screening performed to find out the number of primary neurites per neuron from day 22 (late neural progenitors) to day 30 (immature neurons). Data are represented as mean±s.e.m. Unpaired Student’s t-test with Welch’s correction was performed for each time point; the only difference was seen at day 30. ***P<0.001. (g and i) The number of primary neurites per neuron at days 27 and 30. Data are represented as mean±s.d., ***P<0.001, Student’s t-test was performed, Control neurons n=26.0 × 10³; shank3 neurons n=30.0 × 10³. (h and j) Cumulative frequency distribution of cell soma area at days 27 and 30. (***P<0.001, Kolmogorov–Smirnov test was performed, Control neurons n=26.0 × 10³; shank3 neurons n=30.0 × 10³). We performed three biological replicates. We compared five control lines with four SHANK3 lines, three control lines with two clonal replicates and two SHANK3 lines with one clonal replicate of each.

