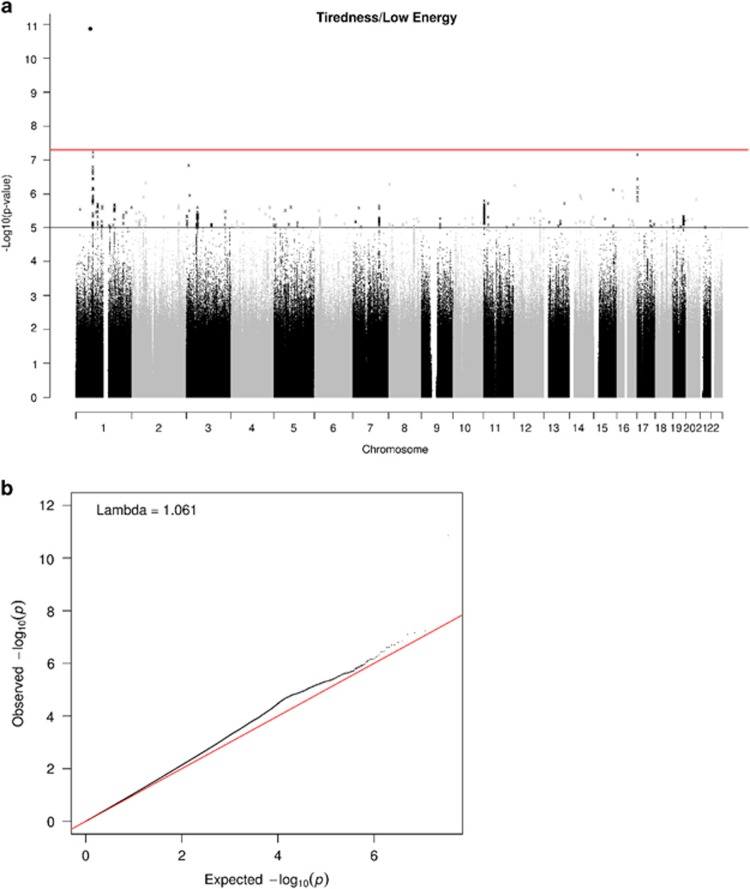
Figure 2.
(a) Manhattan and (b) Q–Q plot of P-values of the SNP-based association analysis of tiredness (responses to the question, ‘Over the past two weeks, how often have you felt tired or had little energy?’). The red line on the Manhattan plot indicates the threshold for genome-wide significance (P<5 × 10⁻⁸); the grey line on the Manhattan plot indicates the threshold for suggestive significance (P<1 × 10⁻⁵). SNP, single-nucleotide polymorphism.

