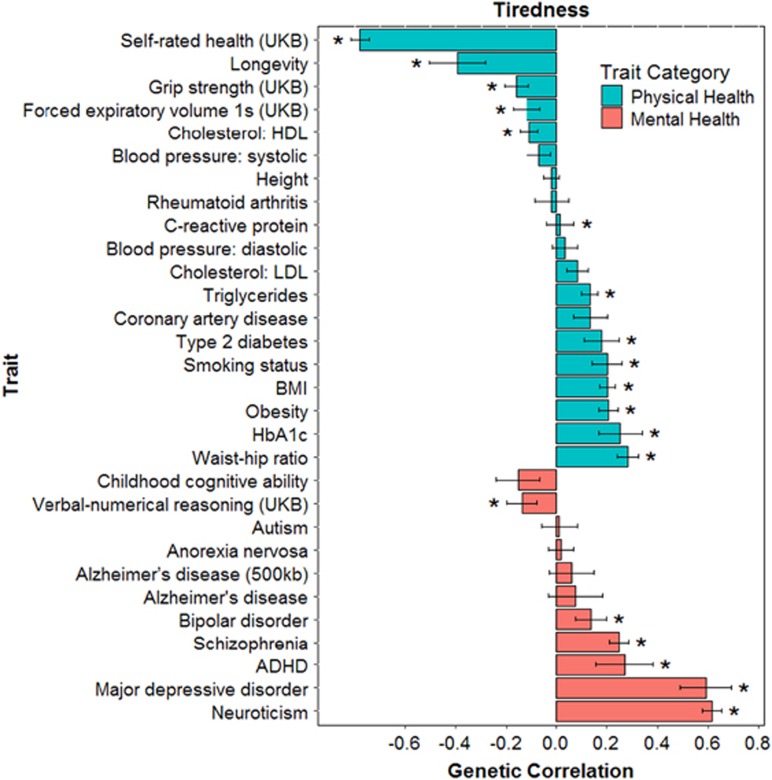
Figure 3.
Barplot of genetic correlations (s.e.) calculated using LD regression between tiredness in UK Biobank and mental and physical health measures from GWAS consortia. *P<0.0281. ADHD, attention deficit hyperactivity disorder; BMI, body mass index; GWAS, genome-wide association study; HDL, high-density lipoprotein; LD, linkage disequilibrium; LDL, low-density lipoprotein.

