Fig. 2.

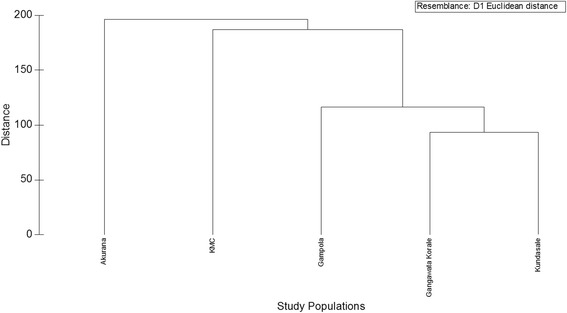
Dendrogram of the cluster analysis of the five study populations in terms of the studied demographic, epidemiological and socio-economic characteristics, showing three clusters at about 120 dissimilarity level of Euclidean distance

Dendrogram of the cluster analysis of the five study populations in terms of the studied demographic, epidemiological and socio-economic characteristics, showing three clusters at about 120 dissimilarity level of Euclidean distance