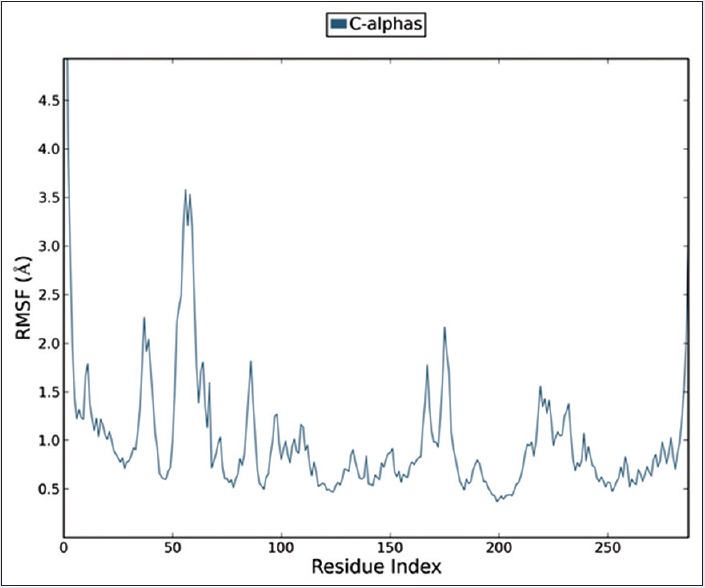
Figure 5.

Root-mean-square fluctuation plot of residue number and C-alpha backbone of protein survivin at 25 ns simulation. It predicts the fluctuation of the backbone atoms; herein, the diagram protein is getting less fluctuating thus restoring the stability of backbone
