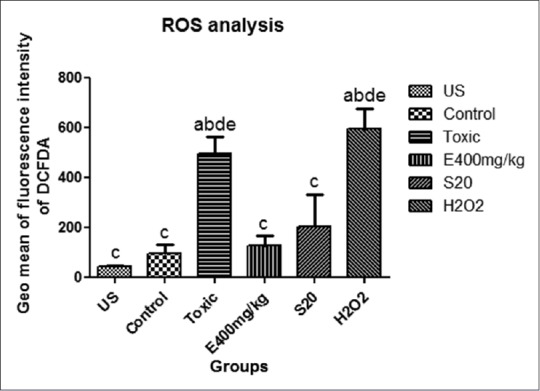
Figure 4.

Geometrical mean values of the fluorescence intensities of respective groups. Values expressed as means ± SEM (n=3). aP<0.05, comparing with unstained, bP<0.05, comparing with control group; cP<0.05, comparing with toxic control group; dP<0.05, comparing with treatment group (ELE 400 mg/kg, p.o); eP<0.05, comparing with S20mg/kg
