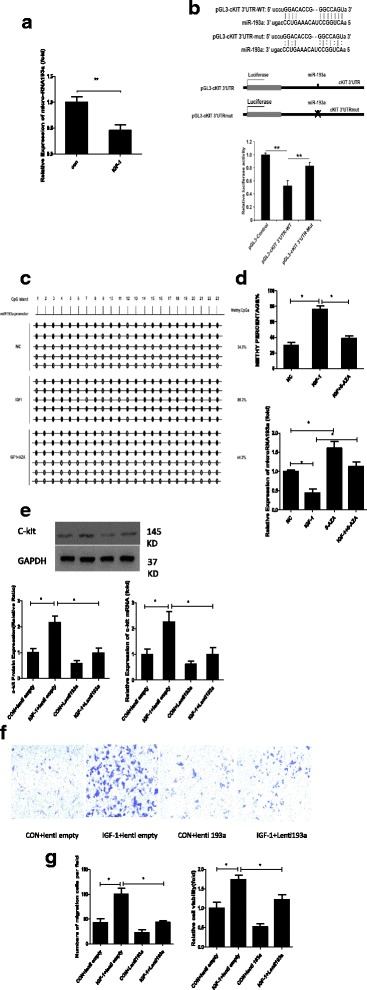
Fig. 5.

miR-193a expression was downregulated in the IGF-1-stimulated group and negatively correlated with c-kit expression. a qPCR was performed to analyze the expression of miR-193a. The data were obtained from three independent experiments and are expressed as the mean ± SD; n = 3. **P < 0.01, versus the control (CON) group. b The putative c-kit binding sequence GAGCA was mutated to CUCGU. The ‘x’ indicates the deleted miRNA-binding site, WT represents the wild-type sequence, and mut represents the mutant sequence. The graph below shows the normalized mean luciferase activity values of cells transfected with the miRNA expression plasmid compared with cells transfected with the empty vector pcDNA3.0; the luciferase activity of cells transfected with the pcDNA3.0 control plasmid was set to 1.0. The bars represent the SD. **P < 0.01. c CSCs were divided into the following groups: normal controls (NC), 100 ng/ml insulin-like growth factor-1 (IGF-1) for 72 h, 1 μM 5-azacytidine (5-AZA) for 72 h, and both IGF-1 and 5-AZA. qPCR was performed to analyze miR-193a expression. The data were obtained from three independent experiments and are expressed as the mean ± SD. *P < 0.05, between groups indicated. d Bisulfite pyrosequencing analysis of the DNA methylation status of the miR-193a promoter region in c-kit positive CSCs. e CSCs were infected with a control lentivirus or a lentivirus expressing miR-193a and stimulated with PBS or 100 ng/ml IGF-1 for 72 h. Western blots were performed to analyze the expression of the c-kit and GAPDH proteins. The data were obtained from at least three independent experiments and are expressed as the mean ± SD. *P < 0.05, between groups indicated. f Representative images of migrated CPCs at 48 h (stained with crystal violet) are shown (×100 magnification). The data were obtained from three independent experiments and are expressed as the mean ± SD; n = 3. *P < 0.05, between groups indicated. g CCK-8 assay of c-kit-positive CSCs from the different groups described above. The data were obtained from three independent experiments and are expressed as the mean ± SD; n = 3. *P < 0.05, versus the control group
