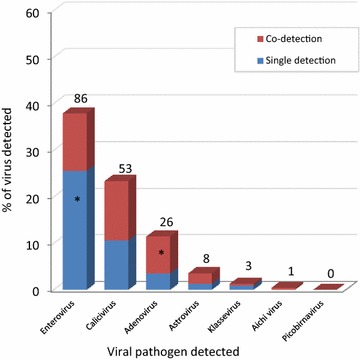
Fig. 4.

Proportion of gastrointestinal viruses involved in single or in coinfection in children with diarrhea from Valencia, 2001–2005. The figure shows the frequency of detection of each virus involved in single infection (only one virus detected, in blue color) or in co-infection (virus simultaneously detected together with one or more viruses, in red color). Numbers above the histogram bars indicate the total number of viruses detected (n = 177) among the 227 children studied. Significant differences (p < 0.05) compared to the rest of the groups are indicated with asterisk (*) inside the histograms
