
Figure 3.
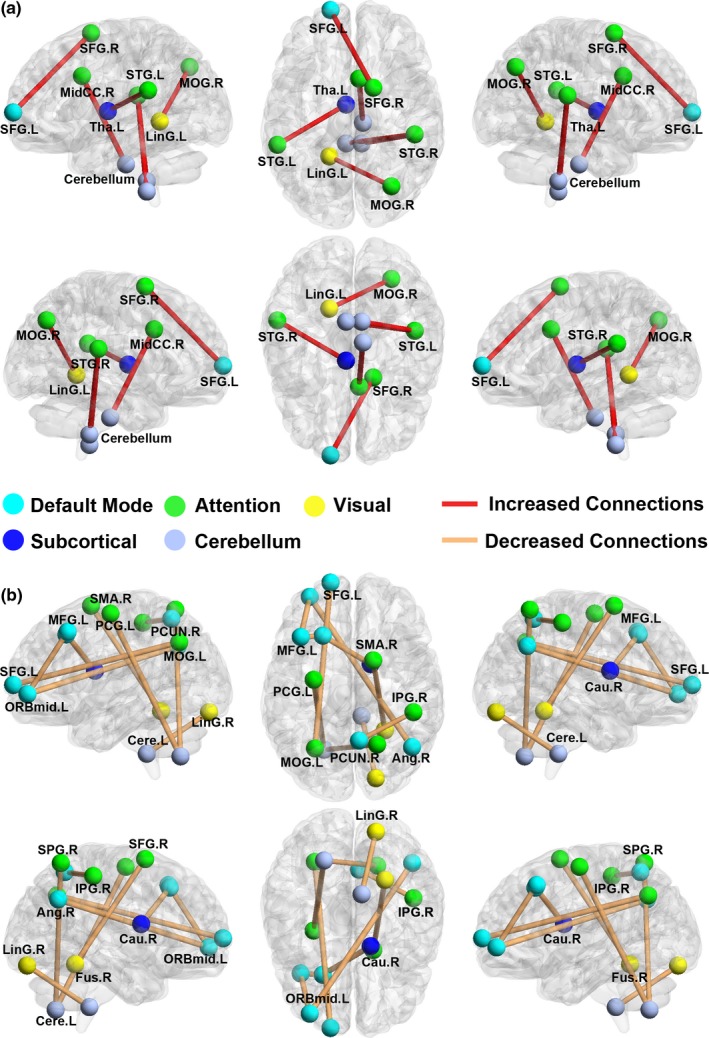
Region pairs exhibiting altered functional connections in the UHL group compared with the control group. (a) UHL patients relative to the control subjects showed significantly increased connectivity with 11 nodes and six connections (FDR corrected p < .05). (b) UHL patients relative to the control subjects showed significantly decreased connectivity with 16 nodes and nine edges (FDR corrected p < .05). The nodes and connections could be categorized into five functional networks: the attention network, default‐mode network, visual network, subcortical network, and cerebellum. The nodes and connections were mapped onto the cortical surfaces using the BrainNet Viewer package (www.nitrc.org/projects/bnv)