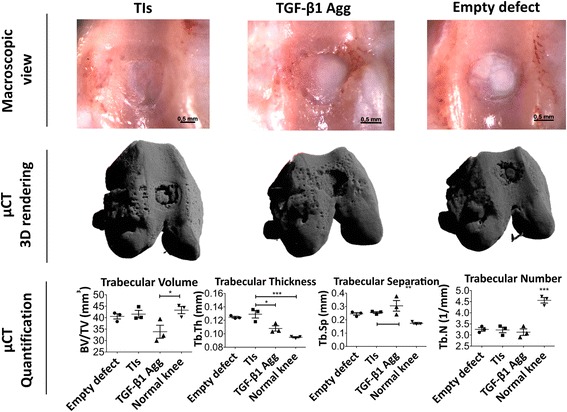
Fig. 4.

Macroscopic view, μCT 3D rendering, and bone quantification and characterization of treated and nontreated osteochondral defects at 8 weeks postinjury. Critical-size osteochondral defects (1 mm depth × 1.4 mm diameter) were treated with tissue intermediates (TIs) or transforming growth factor (TGF)-β1 aggregates (Agg). Empty osteochondral defects were used as negative controls. Macroscopic view of the osteochondral defects showed integration of the implanted constructs at the defect site and similar morphology of those receiving no treatment (empty defects). μCT 3D rendering showed subchondral bone regeneration at the osteochondral defect site. Quantification and characterization of new subchondral bone formation at the defect site was performed by analyzing a region of interest 1.5 mm diameter × 1 mm depth. n = 3 animals per condition. One-way ANOVA followed by Tukey’s multiple comparison test was used to analyze the results. *P < 0.05, **P < 0.01, ***P < 0.001
