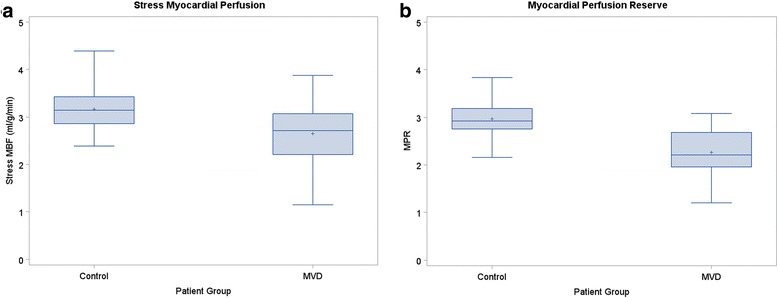
Fig. 2.

Comparison of Stress myocardial blood flow (MBF) and myocardial perfusion reserve (MPR). Box and whisker plots representing stress MBF (a) and MPR (b), between study patients and controls. Stress MBF and MPR were lower in study patients by statistically significant values, p < 0.002 and p < 0.001, respectively. The + sign indicates the mean of each patient group
