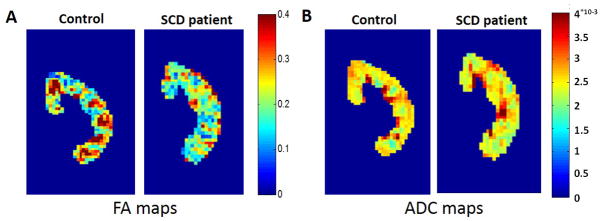
Figure 2.
(A) Representative coronal kidney Fractional Anisotropy (FA) maps of a healthy control subject (age = 26) and a patient with SCD (age = 14). Note the distinctive medullary regions for the control subject (focal red regions, FA > 0.3) indicative of healthy radially-aligned tubules and vessels. These medullary FA values are visibly reduced for the patient with SCD (FA < 0.3). (B) Representative coronal kidney Apparent Diffusion Coefficient (ADC) maps of a healthy control subject (age = 26) and a patient with SCD (age = 14). Note the relative similarity of the ADC maps between the control and the SCD patient despite known iron loading in the SCD patient population.

