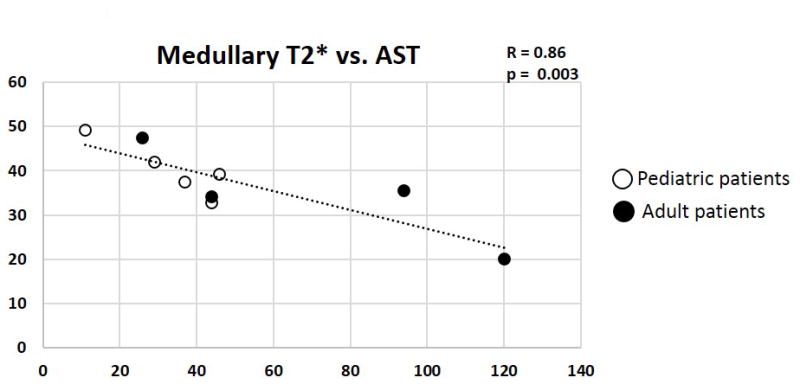
Figure 5.

Scatterplot of medullary T2* values plotted against corresponding Aspartate Aminotransferase (AST) values for each patient with SCD (n=9). The pediatric patients are represented by the hollow circles and the adult patients as filled circles. Medullary T2* correlated significantly with AST (p = 0.003). The plot displays a linear regression line and Pearson Correlation coefficient (R).
