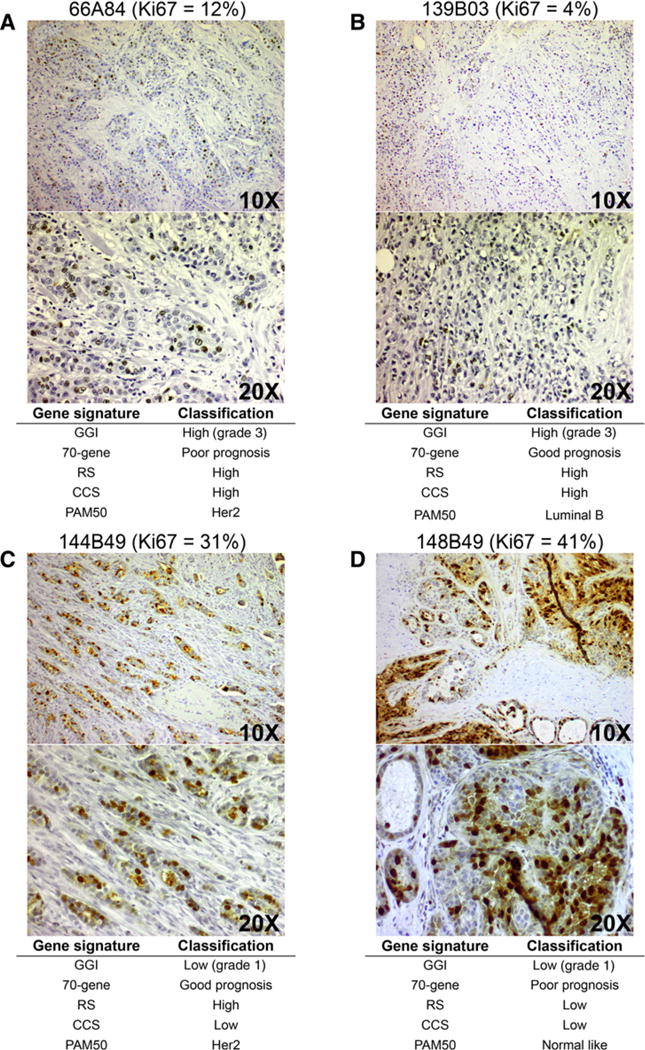
Figure 2.

Representative images of Ki67 expression in discordant tumors, Cohort 2. Ki67 staining and matching gene expression signature calls for representative tumors with low Ki67 expression (≤ 16%; A and B), and representative tumors with high Ki67 expression (≥ 16%; C and D). Images are shown at the top (10×) and bottom (20×). Gene signature calls are given under images. Sample ID is shown at the top of all images along with quantification of Ki67-positive cells (%). All the images were taken using an Olympus BH-2 microscope.
