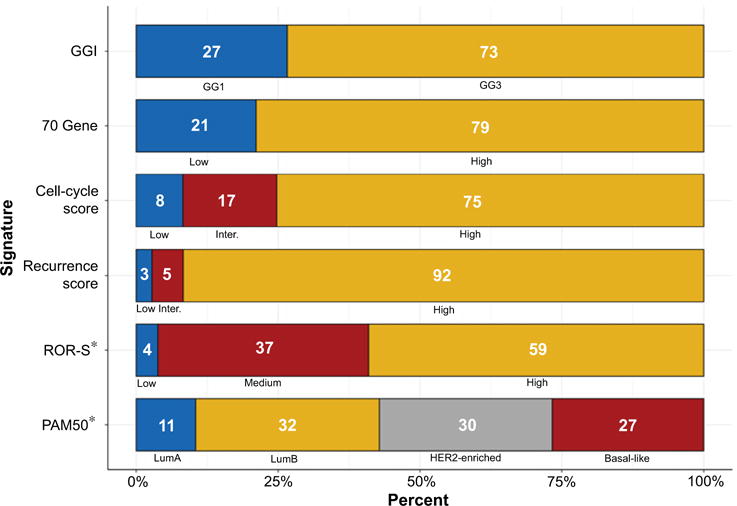
Figure 1.

Distribution of gene expression signature subgroups in breast cancer metastases (N = 109). The distribution of gene expression signature subgroups across all 109 breast cancer metastases; numbers represent the percentage of each signature subgroup. For example, GGI: GG127%, GG3 73%. Blue shading represents expected good prognosis tumors. GGI, Genomic grade index; ROR-S, Risk of recurrence subtype score; *, Reduced numbers (N = 105).
