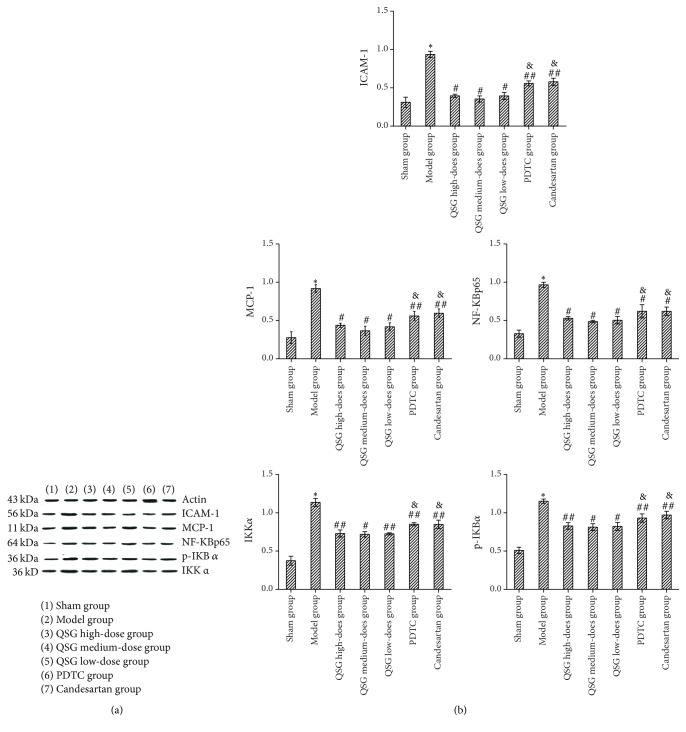
Figure 2.
Expression of ICAM-1, MCP-1, NF-KBp65, p-IKBα, and IKKα in each group. Notes. (a) Original strip chart of Western blot results; (b) relative expression quantity of each protein; ∗ P < 0.01, compared with the sham group; # P < 0.01, ## P < 0.05, compared with the model group; & P < 0.05, compared with the QSG medium-dose group.

