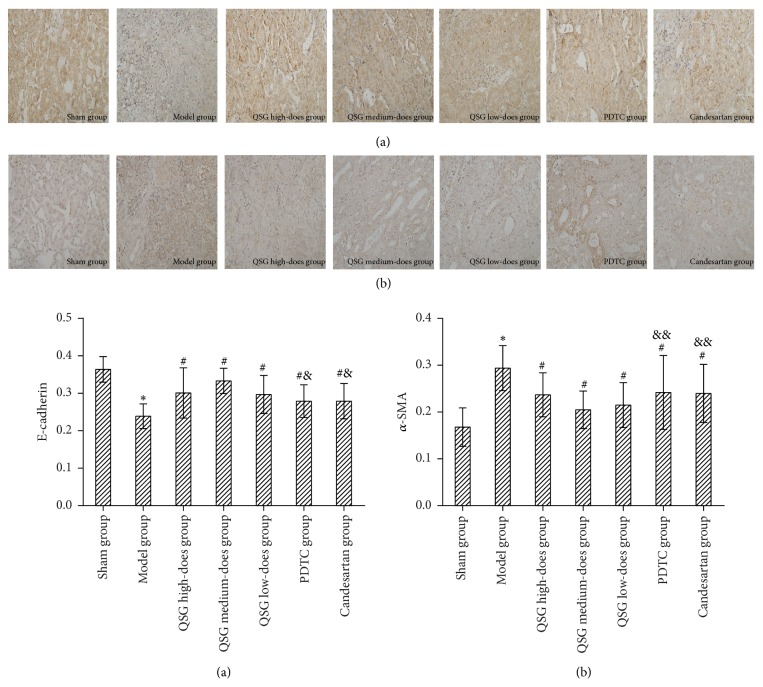
Figure 3.
Comparison of immunohistochemistry and average optical density of E-cadherin and α-SMA protein in each group. Notes. (a) Immunohistochemistry of E-cadherin protein; (b) immunohistochemistry of α-SMA protein. ∗ P < 0.01, compared with the sham group; # P < 0.01, compared with the model group; & P < 0.01, && P < 0.05, compared with the QSG medium-dose group. (×400).

