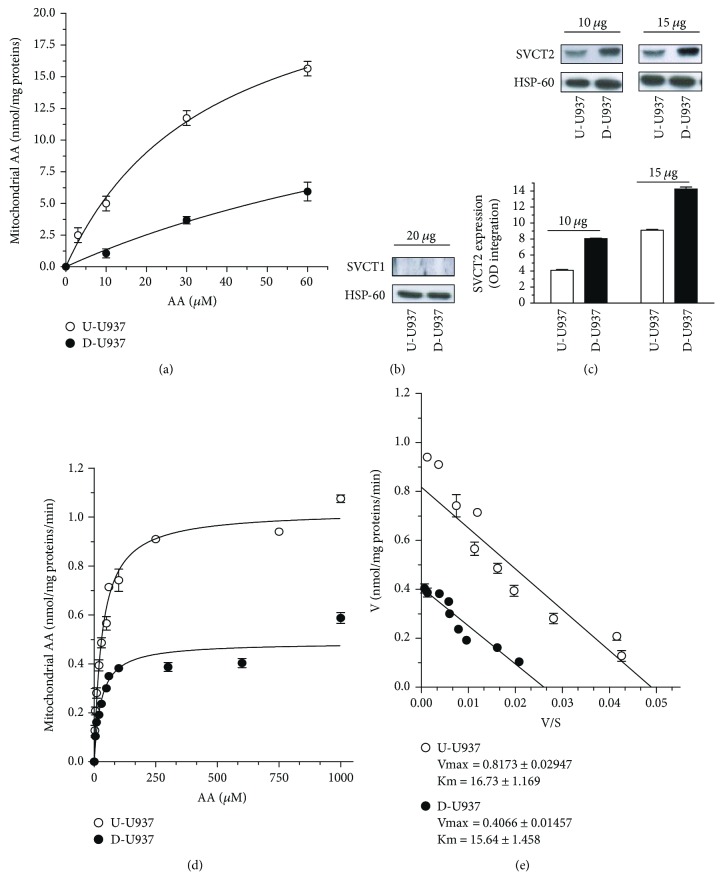
Figure 3.
Mitochondrial uptake of AA in undifferentiated and differentiated cells. (a) Vitamin C content of mitochondria isolated from undifferentiated (U-U937) and differentiated (D-U937) cells immediately after exposure (10 min) to 0–60 μM AA. (b) Western blot analysis of U-U937 and D-U937 cell-derived mitochondrial lysates (20 μg of mitochondrial proteins) using anti-SVCT1 antibodies. (c) Western blot analysis of U-U937 and D-U937 cell-derived mitochondrial lysates (10 and 15 μg of mitochondrial proteins) using anti-SVCT2 antibodies. Anti-HSP-60 antibodies were used to provide an internal loading control and for comparative densitometric analysis. Results represent the means ± SD calculated from at least three separate experiments. (d) Vitamin C content in mitochondria isolated from U-U937 and D-U937 cells and then exposed for 3 min to 0–1000 μM [14C]-AA. Results represent the means ± SD calculated from at least three separate experiments. (e) Eadie-Hofstee plot of the data in C with the calculated Vmax and Km values.

