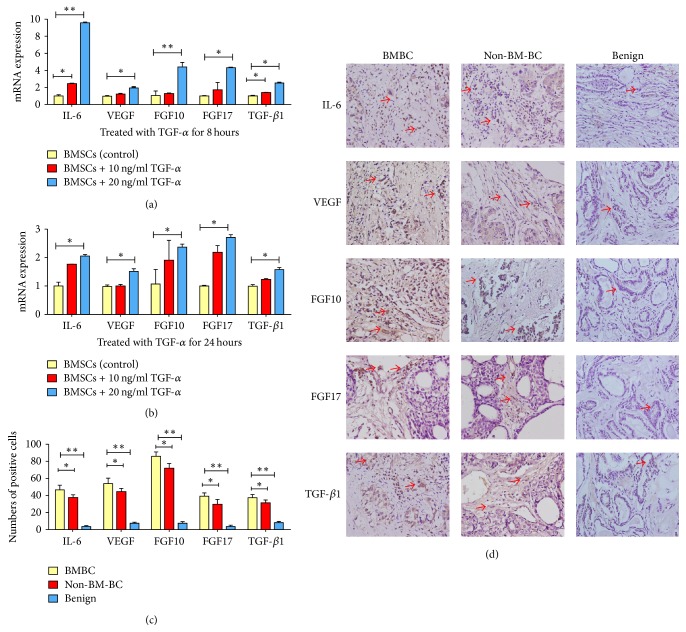
Figure 5.
Changes in mRNA expression of cytokines and growth factors in BMSCs treated with different concentrations of TGF-α. (a) 8 hours after treatment; (b) 24 hours after treatment; (c) comparison of cytokines and growth factors expression in different nontumor tissues around tumor. ∗P < 0.05; ∗∗P < 0.01 compared with no treatment control; (d) cytokines and growth factors expression in different nontumor tissues around tumor (400x, arrows indicating positive cells).

