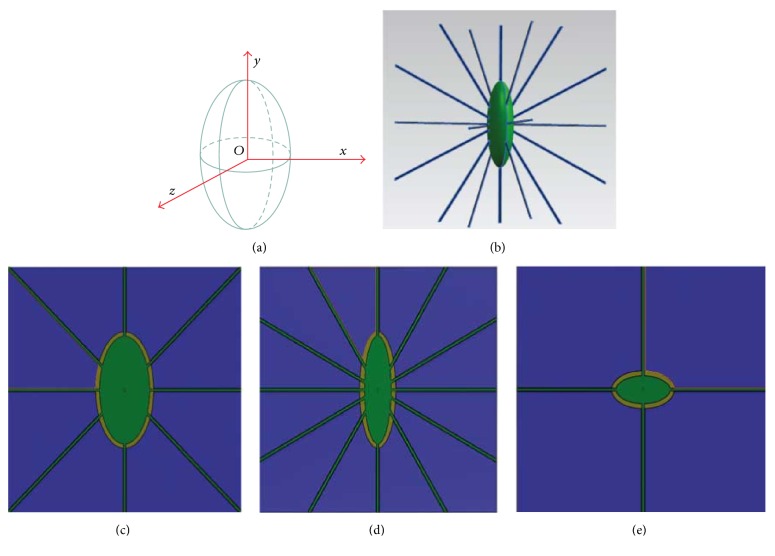
Figure 1.
3-dimensional schematic representations of an idealized osteocyte-lacunar-canalicular system. (a) A schematic diagram of an osteocyte lacuna, where z is the intermediate axis, y the major axis, and x the minor axis of the lacuna in the local coordinate system. Schematic diagrams of osteocyte lacuna and canaliculi, showing (b) osteocyte cell body (green) with processes (blue); (c) in x-y plane; (d) in z-y plane; and (e) in x-z plane.

