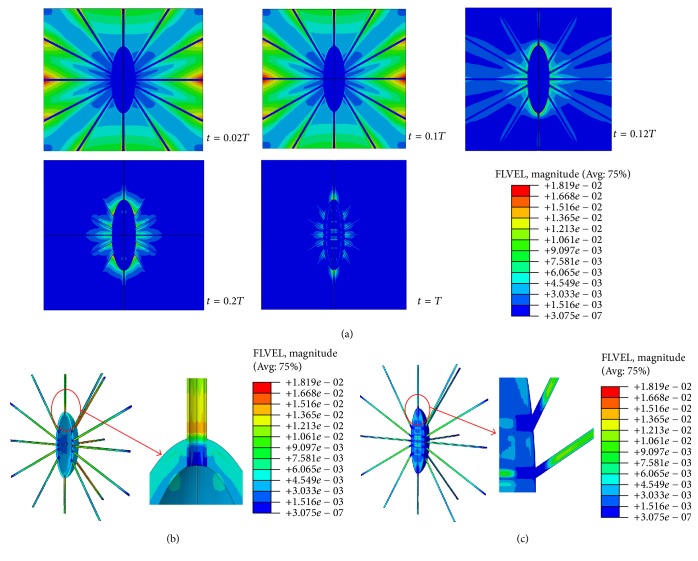
Figure 6.
Fluid velocity distributions of the osteocyte-lacunar-canalicular system under the 1000-microstrain compressive loading. (a) Fluid velocities when t = 0.02, 0.1, 0.12, 0.2, and 1.0T, where T is the relative period of loading; (b) fluid velocity distribution at canaliculi and perilacunar matrix when t = 0.1T; and (c) fluid velocity distribution at the osteocyte and processes.

