Figure 3.
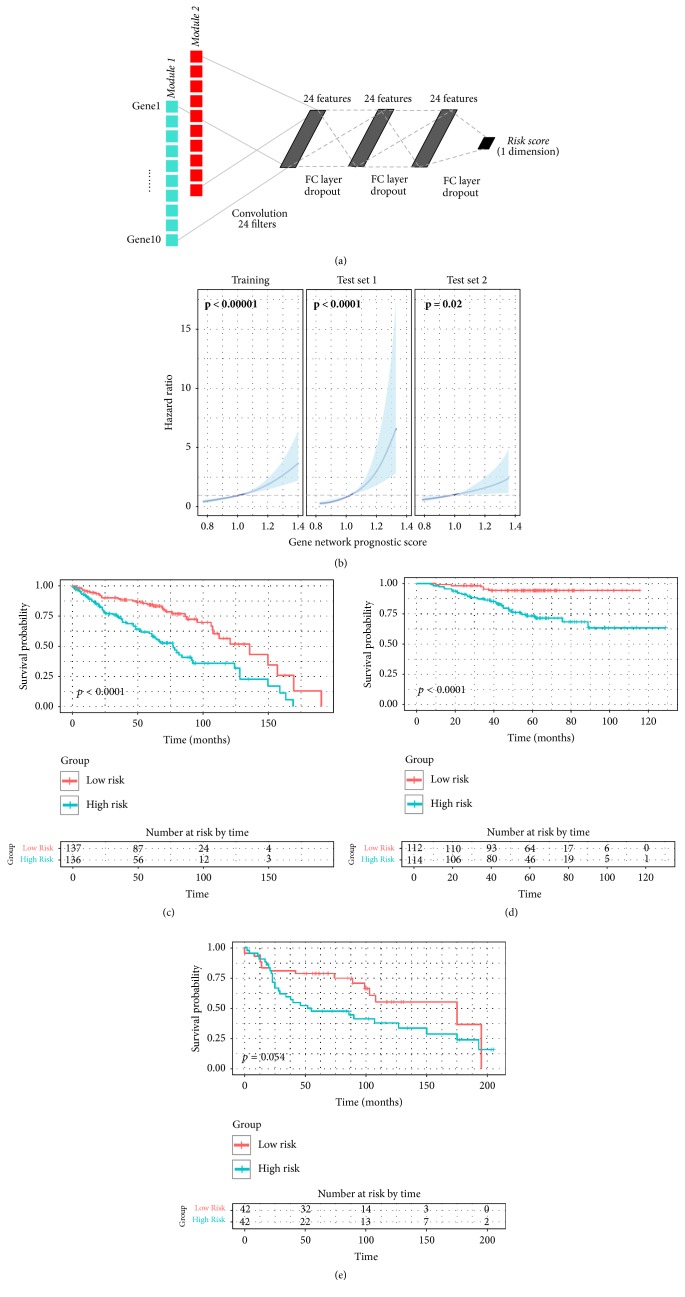
Risk stratification model using representative genes of survival-related network modules. (a) To construct risk stratification model, deep convolutional neural network was used. Input data were expression value of top 10 genes from each of red and turquoise module. The first layer consists of one-dimensional convolutional filters which extract gene expression patterns of each module. Three additional fully connected (FC) layers were followed and connected to the output score gene network prognostic score (NetScore). Detailed training process and architecture of the neural network are described in Supplementary Methods. (b) Univariate Cox regression analysis of NetScore as a continuous variable was performed in the training and two test sets. It shows significant association between the score and overall survival in all sets. The blue line represents hazard ratio for overall survival and the blue area represents 95% confidence interval. (c–e) Overall survival of dichotomized group according to NetScore was depicted by Kaplan-Meier survival curve. The statistical difference was tested by log-rank test. The high-risk group showed worse survival in the training set (c) and test set 1 (d) with statistical significance. The high-risk group of the test set 2 (e) also showed worse prognosis though the difference did not reach statistical significance.

