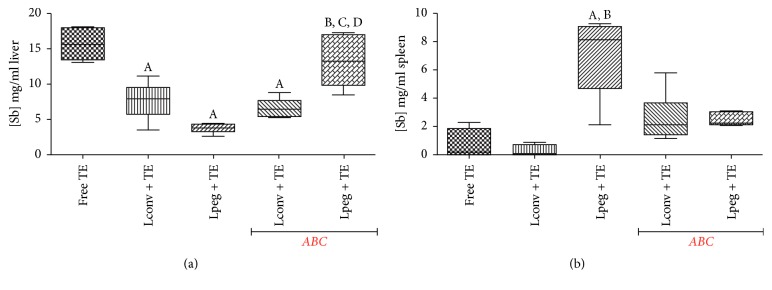
Figure 4.
(a) Concentration of Sb in the liver of BALB/c mice. (b) Concentration of Sb in the spleen of BALB/c mice. The results are represented as median, minimum value, and maximum value (n = 4). Differences were considered statistically significant where p < 0.05 with respect to (A) free TE; (B) Lconv + TE; (C) Lpeg + TE; (D) Lconv + TE with ABC phenomenon. ABC: Accelerated Blood Clearance phenomenon.

