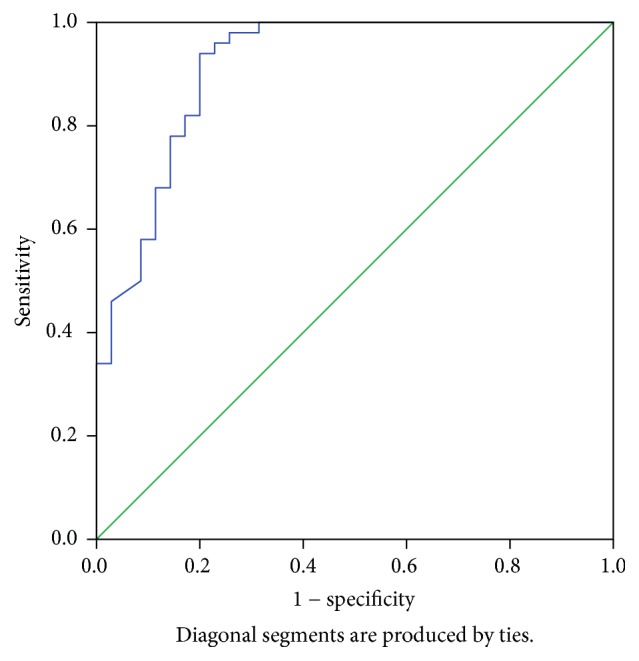
Figure 3.

Receiver operating curve (ROC curve) analysis. Test sensitivity and specificity were 94.0% and 80.0%, respectively, at 1.308 cut-off level.

Receiver operating curve (ROC curve) analysis. Test sensitivity and specificity were 94.0% and 80.0%, respectively, at 1.308 cut-off level.