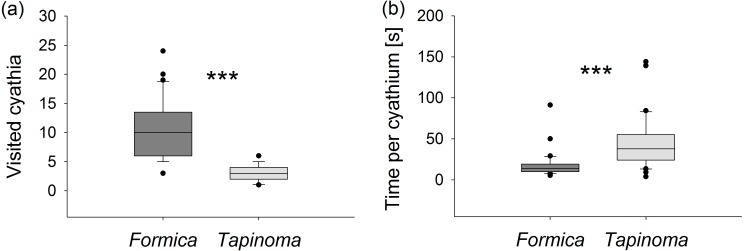
Figure 4. Nectar foraging.
(A) Number of visited cyathia and (B) time spent at nectaries by individual ants during a 5 min observation period. Boxes show median (line), 25th and 75th percentiles. Whiskers are 5th and 95th percentiles. Dots show outliers. Formica, F. cunicularia; Tapinoma, T. erraticum. Mann–Whitney U test, ***p < 0.001; n = 30.

