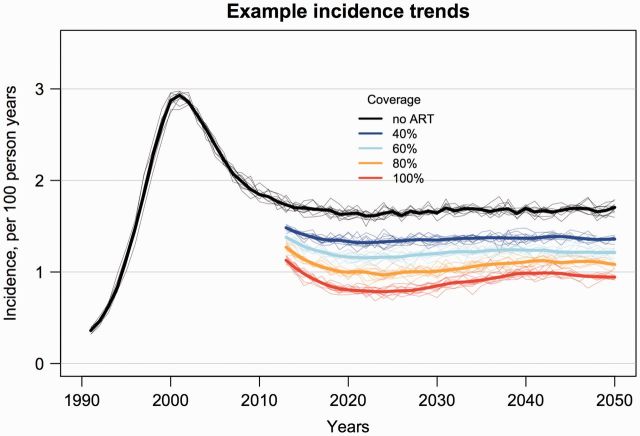
Figure 1.
Simulated trends in HIV incidence for ART scenarios of 40, 60, 80, and 100 percent coverage (individual probability of receiving ART with complete adherence) and CD4 count threshold for treatment initiation <350 cells/ml, versus the counterfactual epidemic simulation with no ART. Shown are LOESS regression lines for ten random replicates for each ART coverage scenario (thin lines), and the mean of these replicates (thick lines). Initial mean SPVL was 4.5 log10 copies/ml.

