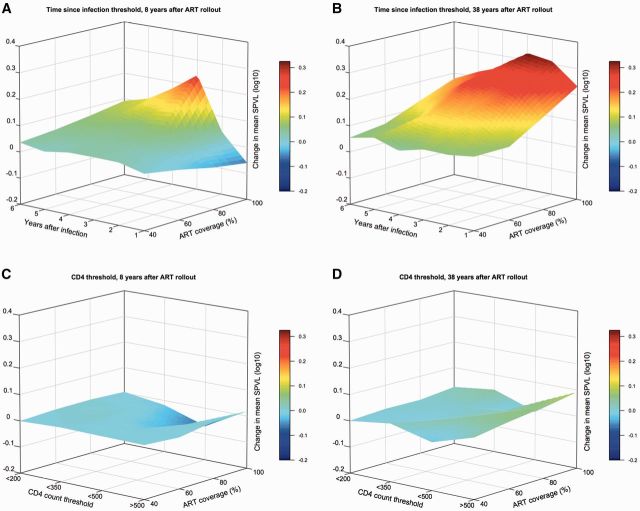
Figure 2.
Surface plots showing change in mean SPVL between epidemic simulations with and without ART, for scenarios of increasing ART coverage (individual treatment probability) and ART initiation based either on time since infection or CD4 count threshold. For epidemic scenarios with ART initiation based on time since infection, (A) shows mean SPVL change 8 years after ART rollout (from year 2012 to 2020), and (B) shows mean SPVL change 38 years after rollout (from year 2012 to 2050). For epidemic scenarios with ART initiation based on CD4 count, (C) and (D) show mean SPVL at 8 and 38 years after rollout, respectively. Linear interpolation was used to estimate mean SPVL values for scenarios in which epidemics were extinguished prior to measurement (see Supplementary Figs. S2 and S5).

