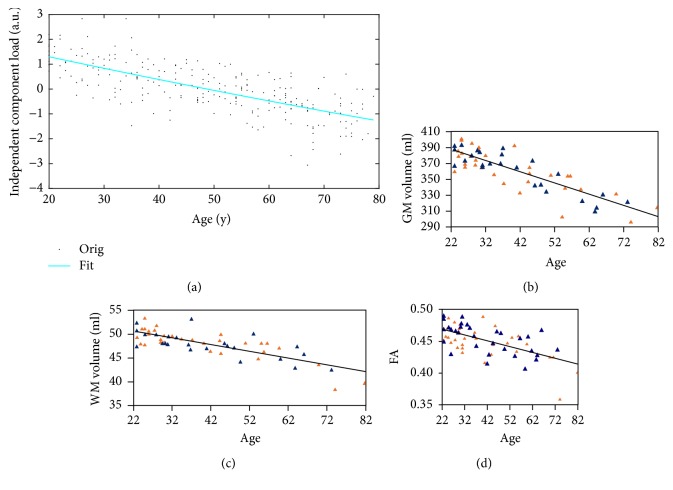
Figure 9.
Similar linear scatter plots of negative correlations between age and different imaging indices. (a) Results from the present study. Correlation between SUVR mean and age. Correlations between (a) IC value (b; c; d) Results in [7]. Correlations between (b) GM volume, (c) WM volume, and (d) FA and age.

