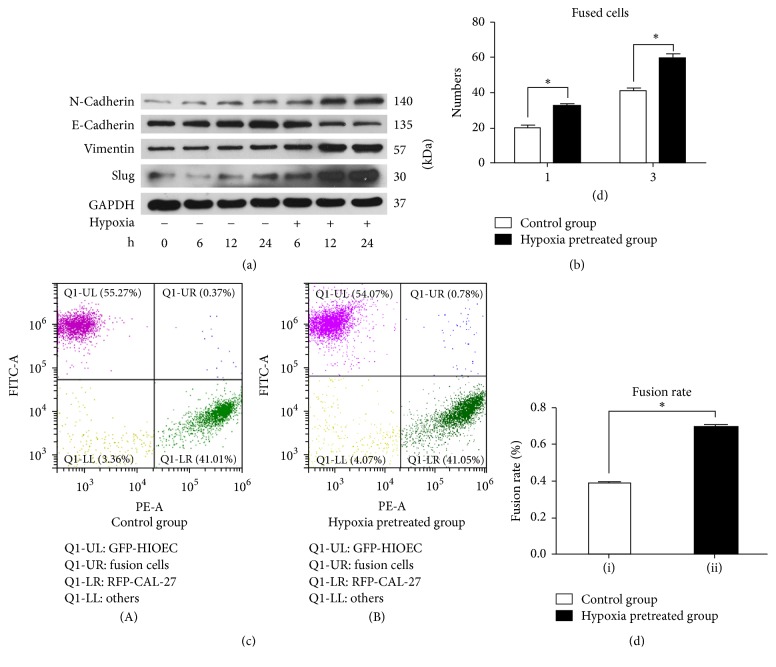
Figure 3.
(a) The expression of EMT-associated indexes including N-cadherin, E-cadherin, Vimentin, and Slug with/without hypoxia stimulation. (b) The number of fused cells by cell counting with/without the pretreated of hypoxia after 1 and 3 days. (∗p < 0.05). (c) The fusion rate of the hypoxia pretreated group and the control group by FACS. (d) Statistical analysis of fusion rate of the hypoxia pretreated group and the control group (∗p < 0.05).

