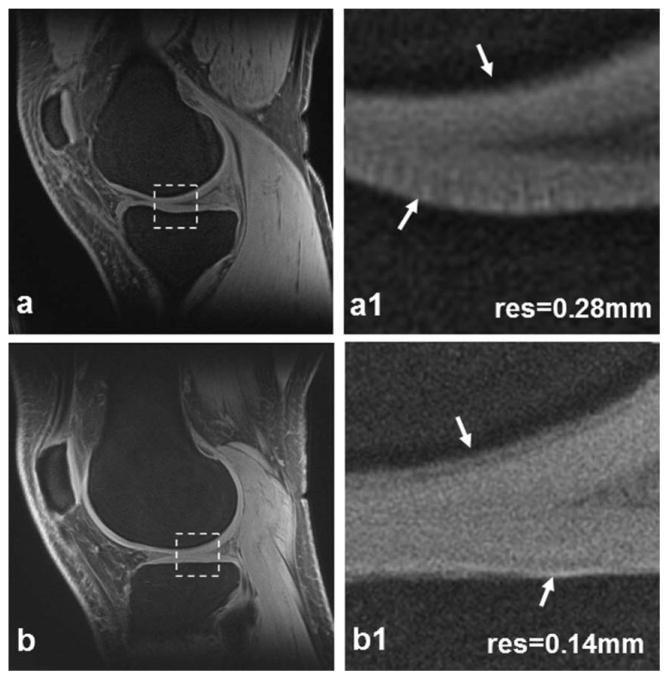
Figure 5.
Tibial/femoral cartilage images of a healthy subject at high-resolution 0.28 mm (a) and higher resolution 0.14 mm (b). The magnified views (a1,b1) are corresponding to the dashed box regions in (a,b) respectively. The higher resolution in (b1) illustrates details inside the cartilage or on the cartilage/bone interface (arrows) more effectively than the high resolution in (a1). (3T scanner, 8-channel knee coil, AWSOS sequence, FOV = 140 mm, TE/TR = 0.6/80 msec, θ = 30°, matrix size = 512, and slice thickness = 2 mm, or TE/TR = 0.6/60 msec, θ = 18°, matrix size = 1024, and slice thickness = 3 mm.)

