
Figure 3.
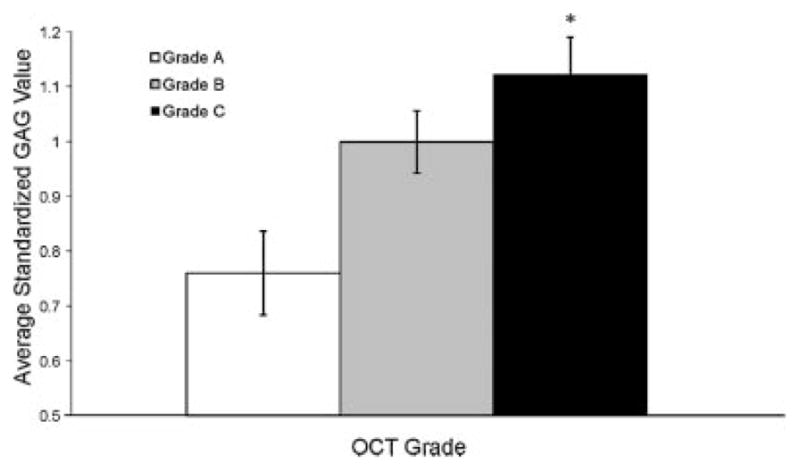
GAG content increased with increasing OCT grade (p = 0.004). Grade A osteochondral cores had significantly lower average GAG values than grade C cores (*p = 0.003), while differences between grade A and B GAG values approached significance (p = 0.08). Overall, cores without birefringence (grades B, C) had a 36% higher GAG content compared to cores with birefringence (p = 0.009). Error bars represent SEM