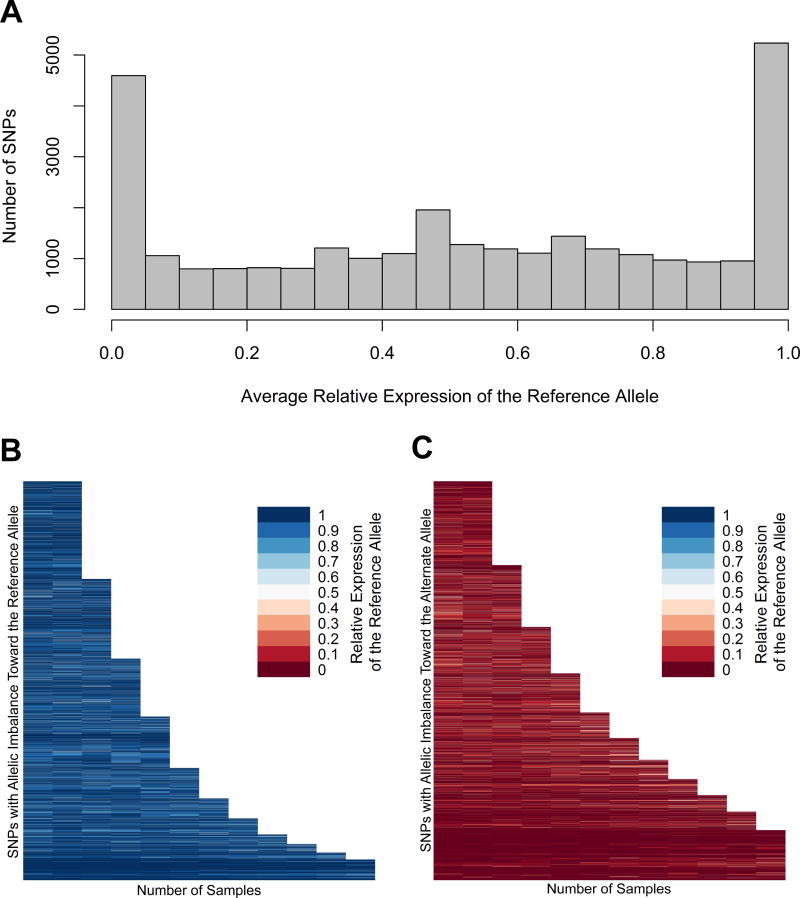
Figure 2.
(A) Frequency distribution histogram of instances of allele-specific expression. The average relative expression (proportion of reads containing the reference allele) was calculated for all transcribed heterozygous SNPs identified in our study. Each bin spans a relative expression range of 0.05. (B) Variants in which the average relative expression of the reference allele is greater than 0.5, and in which the average relative expression is less than 0.5 (C). The relative expression of the reference allele in each SNP with allelic imbalance (binomial p<0.05) in two or more samples is represented on the Y axis. The reference allele is defined by the genotype of the reference genome, which is consistent across all samples. Relative expression ranges from 0 (red) to 1 (blue). The allelic imbalance of specific SNPs is shown to be highly consistent across individuals.

